Why you should launch a data management program – A (data) message to the C-suite

Why you should launch a data management program – A (data) message to the C-suite

Why you should launch a data management program – A (data) message to the C-suite

How do you create quality information from data silos

If you are an executive in a rapidly growing organization whose stated mission is “to be the most successful business in the world” you will be aware that rapid growth brings a lot of excitement, and that this very growth changes the nature of the way the company operates.

Instinctive understanding of the business becomes more challenging as more operating sites and businesses are added to the group. Executives can no longer rely solely on their knowledge of individual sites, and as the business grows, they rely more on reports compiled from the different businesses to keep a grip on the business metrics.

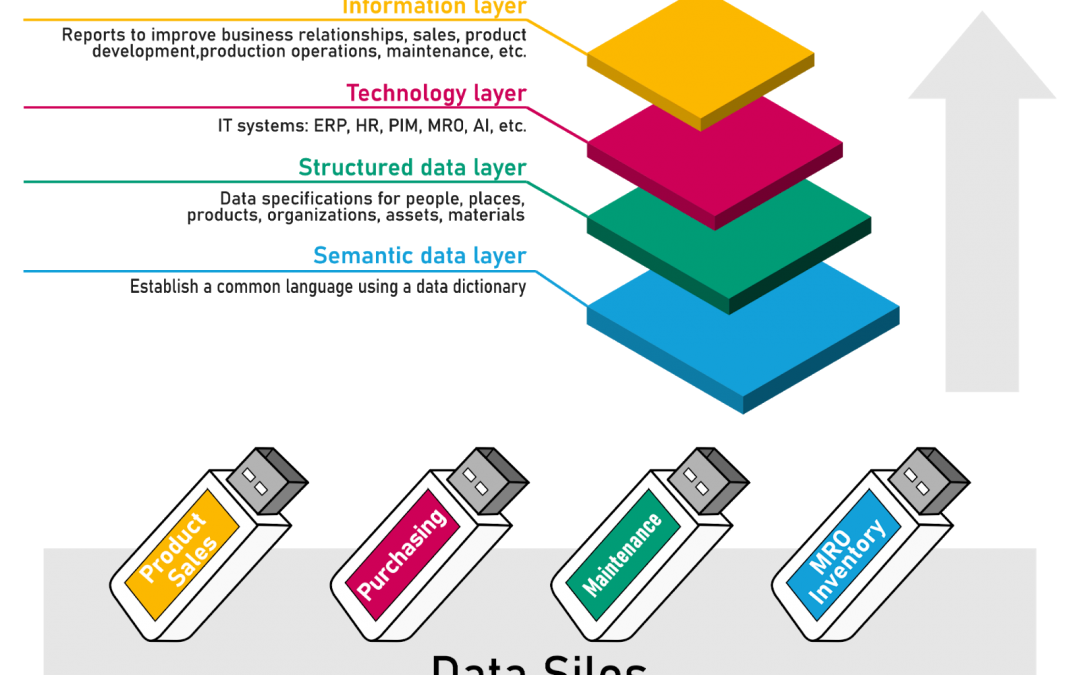
Any significant increase in new data brings new dynamics. Data silos multiply making it more difficult to aggregate data across departments; across sites; across regions; and across national borders. Recently acquired business units will inevitably lack a common language. Some common phrases may even have a different meaning in different parts of the organization. This lack of a common understanding makes it more likely that business opportunities will be missed.

Good quality master data is the foundation for making sound business decisions, and also for identifying potential risks to the business. Why is master data important? Master data is the data that identifies and describes individuals; organizations; locations; goods; services; processes; rules; and regulations, so master data runs right through the business.

All departments in the business need structured master data. What is often misunderstood is that the customer relationship management (CRM) system; the enterprise resource management system (ERP); the payroll system; and the finance and accounting systems are not going to fix poor master data, the software performance always suffers because of poor quality data., but the software itself will not cure that problem.

The key is to recognise what master data is not; master data is not an information technology (IT) function, master data is a business function. Improving master data is not a project. Managing master data is a program and a function that should be at the heart of the business process.

Foundational master data, that is well structured, and good quality is a necessity if your business is going to efficiently and effectively process commercial data; transaction reporting; and business activity. The reality is that well-structured, good quality, master data is also the most effective way to connect multiple systems and processes, both internally and externally.

Good quality data is the pathway to good quality information. With insight from good quality information, business leaders can identify – and no longer need to accept – the basic business inefficiencies that they know exist, but cannot pin down. For a manufacturing company making 5% profit on sales, every $50,000 in operational savings is equivalent to $1,000 000 sales. It follows then, that if you have $50,000 of efficiency savings that you can identify and implement as a result of better quality information, you have solved a million-dollar problem.

If you, as an executive, are unsure of the integrity and accuracy of the very data that is the foundation for the reports you rely on in your organization, launching a master data management program is the best course of action you can take.

Contact us

Give us a call and find out how we can help you.

+44 (0)23 9387 7599

info@koiosmasterdata.com

About the author

Peter Eales is a subject matter expert on MRO (maintenance, repair, and operations) material management and industrial data quality. Peter is an experienced consultant, trainer, writer, and speaker on these subjects. Peter is recognised by BSI and ISO as an expert in the subject of industrial data. Peter is a member ISO/TC 184/SC 4/WG 13, the ISO standards development committee that develops standards for industrial data and industrial interfaces, ISO 8000, ISO 29002, and ISO 22745. Peter is the project leader for edition 2 of ISO 29002 due to be published in late 2020. Peter is also a committee member of ISO/TC 184/WG 6 that published the standard for Asset intensive industry Interoperability, ISO 18101.

Peter has previously held positions as the global technical authority for materials management at a global EPC, and as the global subject matter expert for master data at a major oil and gas owner/operator. Peter is currently chief executive of MRO Insyte, and chairman of KOIOS Master Data.

KOIOS Master Data is a world-leading cloud MDM solution enabling ISO 8000 compliant data exchange

Non Covid-19 deaths by occupation – a closer look

Non Covid-19 deaths by occupation – a closer look

Non Covid-19 deaths by occupation – a closer look

To download this article, please view in PDF and download from the new tab.

ONS data raises important questions about non COVID-19 deaths by occupation

Why have non COVID-19 related deaths in the hairdressing industry risen by 30%?

Following a freedom of information request on the 25th January 2021, The Office of National Statistics (ONS) released the dataset: Coronavirus (COVID-19) related deaths by occupation, England and Wales. [1]

The summary accompanying the dataset concluded that “those working in close proximity to others continue to have higher COVID-19 death rates when compared with the rest of the working age population.” [2]

This data is clearly vital in understanding the impact of lockdown legislation on COVID-19 deaths and informs the growing conjecture about the disease’s disproportionate impact on workers with low, or irregular incomes.

Without doubt, we are fortunate in this country that the ONS provides such valuable insight to enable us to make sense of what is happening. However, the summary drew no conclusions about the increases in non COVID-19 related deaths by occupation, prompting the author to take a closer look. It highlighted a worrying increase in non COVID-19 deaths in one particular occupation – hairdressing.

Delving deeper into the deaths by occupation data

The ONS dataset provides context to the deaths including COVID-19 against the average “expected” deaths over the same period for the past five years. [3]

The main media commentary following the release of the dataset focused on the fact that more men than women of working age had COVID-19 recorded on their death certificates. Overall, the excess deaths for women in the period covered by the dataset was 1,891. The deaths of women attributed to COVID-19 was 1,742, so no significant statistical difference. However, that total figure hides a range of outcomes across the 369 occupations listed in the dataset. When you look at the dataset in more detail some interesting numbers emerge.

In Table 1 at the end of this article (adapted from table 9 of the ONS report), I have added two extra columns: Non COVID-19 excess mortality 2020; and Percentage change Non COVID-19 excess mortality 2020.

At the “top” of the table, now sorted by percentage of non COVID-19 deaths, are hairdressers with an increase in Non COVID-19 excess mortality of 30%. But what accounts for such a marked increase and what are the leading causes of these excess deaths?

Delving deeper still – some concerning increases in several causes of death of hairdressers

Following a request for more detailed information on the mortality rate of the “top” group – hairdressers – the ONS responded very promptly on the 12th February, publishing a new dataset breaking down the leading causes of death. [4]

The total deaths, for men and women, was 398, an increase of 37% compared with the average number of deaths over the past five years covering the same reporting period. COVID-19 accounts for 20 of those deaths.
Table 2 at the end of this article (adapted from table 1 of the second ONS report) shows the top ten causes of death (out of 63) showing dramatic increases in suicide and accidental poisoning among hairdressers, as well as a startling rise in deaths from breast cancer and strokes.

Questions we should ask next

This paper was specifically written to draw attention to a trend overlooked by most commentary on the original dataset release, namely a steep rise in non COVID-19 related deaths in certain professions, and in particular hairdressers.

As more datasets are released covering longer periods of time, new trends in the data will become apparent. It is still too early to draw definite conclusions, and whilst we must always be careful to remember that correlation does not imply causation, these datasets do raise the imperative to ask more questions such as:

  • Why is it that, during this pandemic, COVID-19 was responsible for less than 7% of the 37% increase of deaths in hairdressers?
  • What is driving the increase in nine of the top ten causes of deaths among hairdressers?
  • Breast cancer deaths among hairdressers are up by 44%. Is this figure an outlier, if not, what is driving this increase?
  • What is behind the doubling of deaths from strokes among hairdressers?
  • Deaths from suicide and accidental poisoning are up nearly 50%, and together, are more than double the deaths from COVID-19. Why?

Increased deaths across this many categories in a single occupation cannot simply be dismissed as an outlier, or a one-off event. There will almost certainly be an underlying cause.

Many hairdressers are self-employed and have been unable to work for long periods since March 2020. A lot of money was spent by these businesses to make their salons safe when they reopened after the first lockdown.

There has been a lot of recent commentary in the media about how many excess deaths may have been caused as a result of the lockdown policies. Is this an early indicator of this effect? Certainly, the rises in accidental poisoning and suicides in this – generally low paid – occupation is extremely worrying.

The original dataset, published in January, lacked the context of the occupation size and the median income of each occupation. Obtaining these additional data elements may tell us more about the anecdotal evidence that it is the poor, or those with irregular incomes, who are suffering disproportionately from the lockdown. Perhaps the ONS will add these data fields to the next release.

Hopefully, the NHBF, the trade body for hairdressers, will also study this dataset in more detail and work with their membership to reduce some of the tragic, avoidable deaths in these categories.

Acknowledgement: Open data and the Office for National Statistics

We are very fortunate to have the ONS and an open data policy in the UK. I would like to thank the ONS for their prompt response to my request, and the great work they do in regularly publishing datasets that allow us to examine for ourselves what is really happening. This open data policy allows anyone to delve beyond the headlines we see every day.

Tables

Table 1: Deaths for women by occupation involving ten or more instances of COVID-19

Table 2: Top 10 causes of death among hairdressers

References

[1] https://www.ons.gov.uk/peoplepopulationandcommunity/healthandsocialcare/causesofdeath/bulletins/coronavirusCOVID19relateddeathsbyoccupationenglandandwales/deathsregisteredbetween9marchand28december2020

[2] “Today’s analysis shows that jobs with regular exposure to COVID-19 and those working in close proximity to others continue to have higher COVID-19 death rates when compared with the rest of the working age population. Men continue to have higher rates of death than women, making up nearly two thirds of these deaths.”

Ben Humberstone, ONS, Head of Health Analysis and Life Events, 25th January 2021

[3] The dataset covers deaths involving COVID-19 and all causes by sex (those aged 20 to 64 years), England and Wales, for deaths registered between 9th March and 28th December 2020.

Deaths are defined using the International Classification of Diseases, 10th Revision (ICD-10). Deaths involving COVID-19 include those with an underlying cause, or any mention, of ICD-10 codes :

  • U07.1 (COVID-19, virus identified) or
  • U07.2 (COVID-19, virus not identified).

All causes of death is the total number of deaths registered during the same time period, including those that involved COVID-19.

Table 9 in the dataset breaks the figures down by occupation. Occupation is defined using the Standard Occupation Classification (SOC 2010). The table lists 369 occupations. Table 9 breaks the dataset down further by male and female.
The three columns of figures supplied in the dataset are titled:

  • Deaths involving COVID-19;
  • All causes of death;
  • Average all-cause mortality (2015 to 2019)

[4] https://www.ons.gov.uk/peoplepopulationandcommunity/healthandsocialcare/causesofdeath/adhocs/12888numberofdeathsamonghairdressersandbarbersthoseaged20to64yearsbyleadingcausesofdeathsdeathsregisteredbetween9marchand28december2020englandandwales

About the author

Peter Eales is chair of KOIOS Master Data, a provider of cloud-based data quality software. KOIOS also provides data quality consultancy and training services based on International Standards for data quality. Peter is an internationally recognised expert in the field of characteristic data exchange, and industrial data quality. Peter is a member of a number of International Organization for Standardization (ISO) working groups drafting International Standards in these areas.  

Peter has a daughter who is a self-employed hairdresser

Contact us

+44 (0)23 9387 7599

info@koiosmasterdata.com

Data quality: How do you quantify yours?

Data quality: How do you quantify yours?

Data quality: How do you quantify yours?

Being able to measure the quality of your data is a vital to the success of any data management programme. Here, Peter Eales, Chairman of KOIOS Master Data, explores how you can define what data quality means to your organization, and how you can quantify the quality of your dataset.

In the business world today, it is important to provide evidence of what we do, so, let me pose this question to you: how do you currently quantify the quality of your data?

If you have recently undertaken an outsourced data cleansing project, it is quite likely that you underestimated the internal resource that it takes to check this data when you are preparing to onboard it. Whether that data is presented to you in the form of a load file, or viewed in the data cleansing software the outsourced party used, you are faced with thousands of records to check the quality of. How did you do that? Did you start by using statistical sampling? Did you randomly check some records in each category? Either way, what were you checking for? Were you just scanning to see if it looked right?

The answer to these questions lies in understanding what, in your organization, constitutes good quality data, and then understanding what that means in ways that can be measured efficiently and effectively.

The Greek philosophers Aristotle and Plato captured and shaped many of the ideas we have adopted today for managing data quality. Plato’s Theory of Forms tells us that whilst we have never seen a perfectly straight line, we know what one would look like, whilst Aristotle’s Categories showed us the value of categorising the world around us. In the modern world of data quality management, we know what good data should look like, and we categorise our data in order to help us break down the larger datasets into manageable groups.

In order to quantify the quality of the data, you need to understand, then define the properties (attributes or characteristics) of the data you plan to measure. Data quality properties are frequently termed “dimensions”. Many organizations have set out what they regard as the key data quality dimensions, and there are plenty of scholarly and business articles on the subject. Two of the most commonly attributed sources for lists of dimensions are DAMA International, and ISO, in the international standard ISO 25012.

There are a number of published books on the subject of data quality. In her seminal work Executing Data Quality Projects: Ten Steps to Quality Data and Trusted Information™ (Morgan Kaufmann, 2008), Danette McGilvary emphasises the importance of understanding what these dimensions are and how to use them in the context of executing data quality projects. A key call out in the book emphasises this concept.

“A data quality dimension is a characteristic, aspect, or feature of data. Data quality dimensions provide a way to classify information and data quality needs. Dimensions are used to define, measure, improve, and manage the quality of data and information.
The data quality dimensions in The Ten Steps methodology are categorized roughly by the
techniques or approach used to assess each dimension. This helps to better scope and plan a project by providing input when estimating the time, money, tools, and human resources needed to do the data quality work.

Differentiating the data quality dimensions in this way helps to:
1) match dimensions to business needs and data quality issues;
2) prioritize which dimensions to assess and in which order:
3) understand what you will (and will not) learn from assessing each data quality dimension, and:
4) better define and manage the sequence of activities in your project plan within time and resource constraints”.

Laura Sebastian-Coleman in her work Measuring Data Quality for Ongoing Improvement, 2013 sums up the use of dimensions as follows:

“if a quality is a distinctive attribute or characteristic possessed by someone or something, then a data quality dimension is a general, measurable category for a distinctive characteristic (quality) possessed by data.

Data quality dimensions function in the way that length, width, and height function to express the size of a physical object. They allow us to understand quality in relation to a scale or different scales whose relation is defined. A set of data quality dimensions can be used to define expectations (the standard against which to measure) for the quality of a desired dataset, as well as to measure the condition of an existing dataset”.

Tim King and Julian Schwarzenbach in their work, Managing Data Quality – A practical guide (2020) include a short section on data characteristics, that also reminds readers that when defining a set of (dimensions) it depends on the perspective of the user; back to Plato and his Theory of Forms from where the phrase “beauty lies in the eye of the beholder” is derived. According to King and Schwarzenbach quoting DAMA UK, 2013, the six most common dimensions to consider are:

  • Accuracy
  • Completeness
  • Consistency
  • Validity
  • Timeliness
  • Uniqueness

The book also offers a timely reminder that international standard ISO 8000-8 is an important standard to reference when looking at how to measure data quality. ISO 8000-8 describes fundamental concepts of information and data quality, and how these concepts apply to quality management processes and quality management systems. The standard specifies prerequisites for measuring information and data quality and identifies three types of data quality: syntactic; semantic; and pragmatic. Measuring syntactic and semantic quality is performed through a verification process, while measuring pragmatic quality is performed through a validation process.

In summary, there is plenty of resource out there that can help you with understanding how to measure the quality of your data, and at KOIOS Master Data, we are experts in this field. Give us a call and find out how we can help you.

Contact us

In summary, there is plenty of resource out there that can help you with understanding how to measure the quality of your data, and at KOIOS Master Data, we are experts in this field. Give us a call and find out how we can help you.

+44 (0)23 9387 7599

info@koiosmasterdata.com

About the author

Peter Eales is a subject matter expert on MRO (maintenance, repair, and operations) material management and industrial data quality. Peter is an experienced consultant, trainer, writer, and speaker on these subjects. Peter is recognised by BSI and ISO as an expert in the subject of industrial data. Peter is a member ISO/TC 184/SC 4/WG 13, the ISO standards development committee that develops standards for industrial data and industrial interfaces, ISO 8000, ISO 29002, and ISO 22745. Peter is the project leader for edition 2 of ISO 29002 due to be published in late 2020. Peter is also a committee member of ISO/TC 184/WG 6 that published the standard for Asset intensive industry Interoperability, ISO 18101.

Peter has previously held positions as the global technical authority for materials management at a global EPC, and as the global subject matter expert for master data at a major oil and gas owner/operator. Peter is currently chief executive of MRO Insyte, and chairman of KOIOS Master Data.

KOIOS Master Data is a world-leading cloud MDM solution enabling ISO 8000 compliant data exchange

Blockchain: Potential Uses – Incorporating International Standards – Part 1

Blockchain: Potential Uses – Incorporating International Standards – Part 1

Blockchain

Potential uses incorporating international standards (Part 1)

Presentation to the Industry Blockchain Expedition
Linz, Austria
26th November 2018

Introduction

This is the online version of a speech that I was asked to deliver at the ‘Industry Blockchain Expedition‘  hosted in Linz, Austria. We have included the visuals and video’s used to illustrate some of the concepts of Blockchain and its use. This is rather a lengthy blog so, I have included a shortcut menu on the right, so you can navigate to an area of interest or resume reading.

I would like to thank the organisers of this event for inviting me to speak with you today. When I received the invitation, initiated I believe by Paul Dietl, a contact I have been working with at SKF in Steyr, I was obliged to explain to the team that I am not a blockchain expert, although I am working on a potential use case for blockchain.

However, as I explained, that one interesting feature of this use case that was different to any others we had come across, was that we were incorporating international standards into the solution.

“Perfect”, said the organisers.

So here I am!

I have three aims to achieve in my talk today:

  1. To demystify blockchain;
  2. To show the role international standards will play in the growth of blockchain;
  3. To demonstrate how small businesses can find practical applications for blockchain technology and benefit from this technology.

Firstly, to give you some context. I am not an academic, I not employed by the UK government, nor am I employed by a global corporation, although I have worked for global corporations in the past.

I am a small business owner, I have two businesses; the longer established business is my consultancy business, through which I help companies with their materials management issues.

A large part of my time in that business is helping organisations resolve their materials management issues, the root cause of which is frequently poor data quality.

My efforts to find appropriate tools that incorporated international data quality standards to help solve these data quality issues that my clients were facing was frustrating, and so, a couple of years ago I decided to start my own software company to create the software that I felt the market needed.

I am recognised by the British Standards Institute and the International Organization for Standardization as an industrial data expert, I give up a lot of my time developing standards in that area, and I sit on two international working groups.

Following this meeting I am off to Houston for a weeks work on the oil and gas interoperability standard ISO 18101 that will be published next year.

This talk is presented from the perspective of my software company, KOIOS Master Data Limited.

Before you hear me speak on the subject, I would like to play you a short advertisement created by IBM to explain blockchain.

IBM Blockchain: The Blockchain built for smarter business

Building a Blockchain

The first block

  • The first block contains initial information;
  • This information could take the form of transactional data or master data;
  • This block represents the start of a blockchain

Blockchain was created to securely exchange transaction data; to record tangible and intangible assets; and to create an alternative to central bank controlled currencies.

One compelling feature of blockchain is that these records are immutable; that means that they are unchanged over time, and unable to be altered.

As you saw in the video, implementations of blockchain have moved beyond alternative currencies, and are being used to record master data as well as transactional data.

A block is essentially a data record, just like an individual record in a traditional ledger.

The second block

  • The user creates the second block and it links to the first block

When a second block of data is added it is linked to the first block, creating a chain.

Blocks record the time and the sequence of transactions. Each block contains a HASH key, which is a unique digital identifier.

The third block

      • The third block in the chain is created and links to the second block;
      • New blocks are always added to the latest block;
      • Blockchains store transactional data;
      • A hyperledger can contain both master data and transactional data

When a third block of data is added to the chain, it links to the second block, not the first block. All blocks are linked sequentially.

As I mentioned earlier, there are a number of ways to implement blockchain, and in this presentation we will be discussing examples where Hyperledger may be the appropriate technology.

Hyperledger is hosted by the Linux foundation, an open source community, whose vision is to be the facilitator for mainstream commercial applications.

Blockchain is decentralized

      • A blockchain can be thought of in terms of transaction data storage in the same way as a database;
      • The key difference to traditional databases is that blockchain is decentralized;

Another key feature of blockchain is the decentralised architecture. This decentralisation means that there is no single point of failure that would bring the network down. This is a key differentiator to the traditional single database model that is increasingly vulnerable in today’s world.

What is a Network Node?

      • Network nodes enable blockchain to be decentralized
      • The role of a node is to support the network by maintaining a copy of a blockchain.
      • All participants in a private, permissioned, system can be a part of the network

Decentralisation is achieved by the creation of network nodes. A network node is another term for a computer that maintains a copy of the database.

What happens when
a ‘Node’ is corrupted?

      • If a third party alters a part of the chain the network may determine that the blockchain on that node is no longer the longest chain and is potentially corrupt.

I explained earlier that each block contains a unique HASH key as well as the HASH key of the previous block. This architecture is designed to ensure it is impossible to insert a new block between two existing blocks, or to alter the contents of a block without detection.

Should there be a conflict, then protocols such as Practical Byzantine Fault Tolerance (PBFT) are used as a method of conflict resolution.

Terminology

One difficulty in understanding the topic is the bewildering array of terminology. One particular term that can cause confusion is ‘distributed’, which can lead to the misconception that because something is distributed there is therefore no overall controlling authority or owner.

This may or may not be the case — it depends on the design of the ledger. In practice, there is a broad spectrum of distributed ledger models, with different degrees of centralization and different types of access control, to suit different business needs.

These may be ‘unpermissioned’ ledgers that are open to everyone to contribute data to the ledger and cannot be owned; or ‘permissioned’ ledgers that may have one or many owners and only they can add records and verify the contents of the ledger.

In my efforts to demystify blockchain, I have already introduced a number of terms that may be unfamiliar to people new to the subject. In my standards work, terms and definitions are a vital element of the documents we produce.

In this slide pack, that will be distributed after this event, I have added an annex with explantations of some of the terms for you to study at a later date. I will also add a copy of this speech and the slides to the KOIOS website.

When blockchain is discussed, one of the areas of confusion is the term “distributed’ as in distributed ledger. The word distributed may imply to some people that there is no overall control or authority.

That may or may not be the case.

All distributed ledger applications are designed for the specific use case, and that use case will determine the degree of central control and other parties access control.

More from this presentation

Blockchain: Potential Uses – Incorporating International Standards – Part 2

Blockchain: Potential Uses – Incorporating International Standards – Part 2

Blockchain

Potential uses incorporating international standards (Part 2)

INTERNATIONAL 

DATA STANDARDS

International Data Standards

As I discussed earlier, I am actively involved in the development of international standards.

Standards are a consensus of best practice. International standards affect many areas in our everyday lives, and I am going to show a short video to highlight this.

But, before I start the video, can I please have a show of hands? If you have heard of the standard ISO 8000, can you please raise your hand. If you thought I said ISO 9000, please put your hand down!

Thank you. Let us watch this short video showing how ISO Standards influence the world around us.

What ISO standards do for you

As you can see from the video, ISO 8000 is the international standard covering data quality; and part 110 covers the exchange of quality data.

Why is this relevant?

Blockchain is not a cure for data quality problems, if you exchange poor quality data in a blockchain you have the same issues as you do currently when you exchange poor quality data using traditional methods.

By adopting ISO 8000, organisations will benefit enormously from improved data quality; data provenance; data interoperability; and improved operational efficiency.

Facsimile of ISO 800-115: Source iso.org

The working group that develops ISO 8000 is one of the most active ISO working groups, and this year we published ISO 8000-115, the standard for the exchange of quality identifiers. Identifiers are used to point to data records, but before this standard was introduced it was rare for an identifier to state who owns the identifier, or part number, and the associated data record. The lack of the prefix leads to confusion over the provenance of the relevant data set.

The syntax of an ISO 8000-115 complaint identifier ensures that the owner of the data set is clearly identified by the adoption of this standard. The standard also requires that the complete identifier resolves to an ISO 8000-110 complaint specification.

The data cleaning industry is guilty of creating data specifications with no other provenance than their own, which frankly is no guarantee of accuracy or quality. If you employ third party data cleaners, I challenge you to ask them about provenance and data quality standards, and compare their answers with these slides.

Facsimile of ISO 800-116: Source iso.org

I will be talking more about trust shortly.

A key element of trust in commercial contracts is knowing who you are dealing with. Know your Client or customer (KYC) is becoming an accepted business and compliance norm.

ISO 8000-116 is an implementation of ISO 8000-115. ISO 8000-116 will be published early in 2019. The standard defines a method of identifying organisations and individuals by the using the reference of the issuing authority that created the record.

In Austria, the Federal Ministry of Justice maintains the commercial register, and each company has a registration number. This number is used as the suffix of the identifier, and the prefix is the ISO two letter code for Austria (AT), followed by CR for the commercial register.

This format allows every organisation to be given a globally unique authoritative identifier, not a proxy identifier issued by a third party.

This will prove a very useful standard for managing your supplier database and eliminating duplicate records.

The Electronic Commerce Code Management Association (ECCMA) has launched a very useful website www.ealei.org where you can search a growing, global, authoritative register of companies. I encourage you to add your company details to the site.

Facsimile of ISO TC/307: Source iso.org

ISO creates standards through a series of technical committees and working groups. Blockchain and distributed ledger technologies are being developed by technical committee 307.

Technical committees and working groups consist of experts from participating member countries. Technical committee 307 consists of 39 participating members, and the Austrian Standards Institute (ASI) is the member body through which local experts are appointed to help develop the standards.

Facsimile of ISO TC/307: Source iso.org

This technical committee is currently responsible for developing 11 standards under the heading of blockchain and distributed ledger technology. Subjects include governance, interoperability, smart contracts, and data protection.

Technological convergence

The convergence of creativity and technology can lead to radical changes in existing business models and the organizational structures they sit within.

Distributed Ledger Technology (DLT) is presently as much a series of challenges and questions to existing structures, as opposed to a set of answers and practical possibilities.

But it appears to have at least some qualities, and to be in the appropriate context, to produce change at the more revolutionary end of the spectrum.

DLTs offer significant challenges to established orthodoxy and assumptions of best practice, far beyond the recording of transactions and ledgers. These potentially revolutionary organizational structures and practices should be experimentally trialled — perhaps in the form of technical and non-technical demonstrator projects — so that practical, legal and policy implications can be explored.

More from this presentation